Inside the Black Box: Beyond the Green Box
Pretty much all of our investment decision-making happens amid uncertainty. As rational investors, we seek to maximize our opportunities while minimizing our risks. More accurately, since these two goals are generally in tension, we seek to construct a portfolio with the right risk/reward ratio, given our goals, cash flow requirements, time horizon, and financial and psychological ability to assume risk.
Every day, the global financial markets present us with a diverse, confusing and ever-changing opportunity set. We must constantly weigh a variety of potential investments against each other.
Since we live in the here-and-now, our thinking is naturally dominated by near-term considerations. If we buy a security today, what will that investment do tomorrow? Over the next year? If we can determine reliable answers to those questions, we need not look any further. We can construct a profitable future out of a series of successful one-year decisions.
But can we make such decisions reliably? The chart below suggests not:
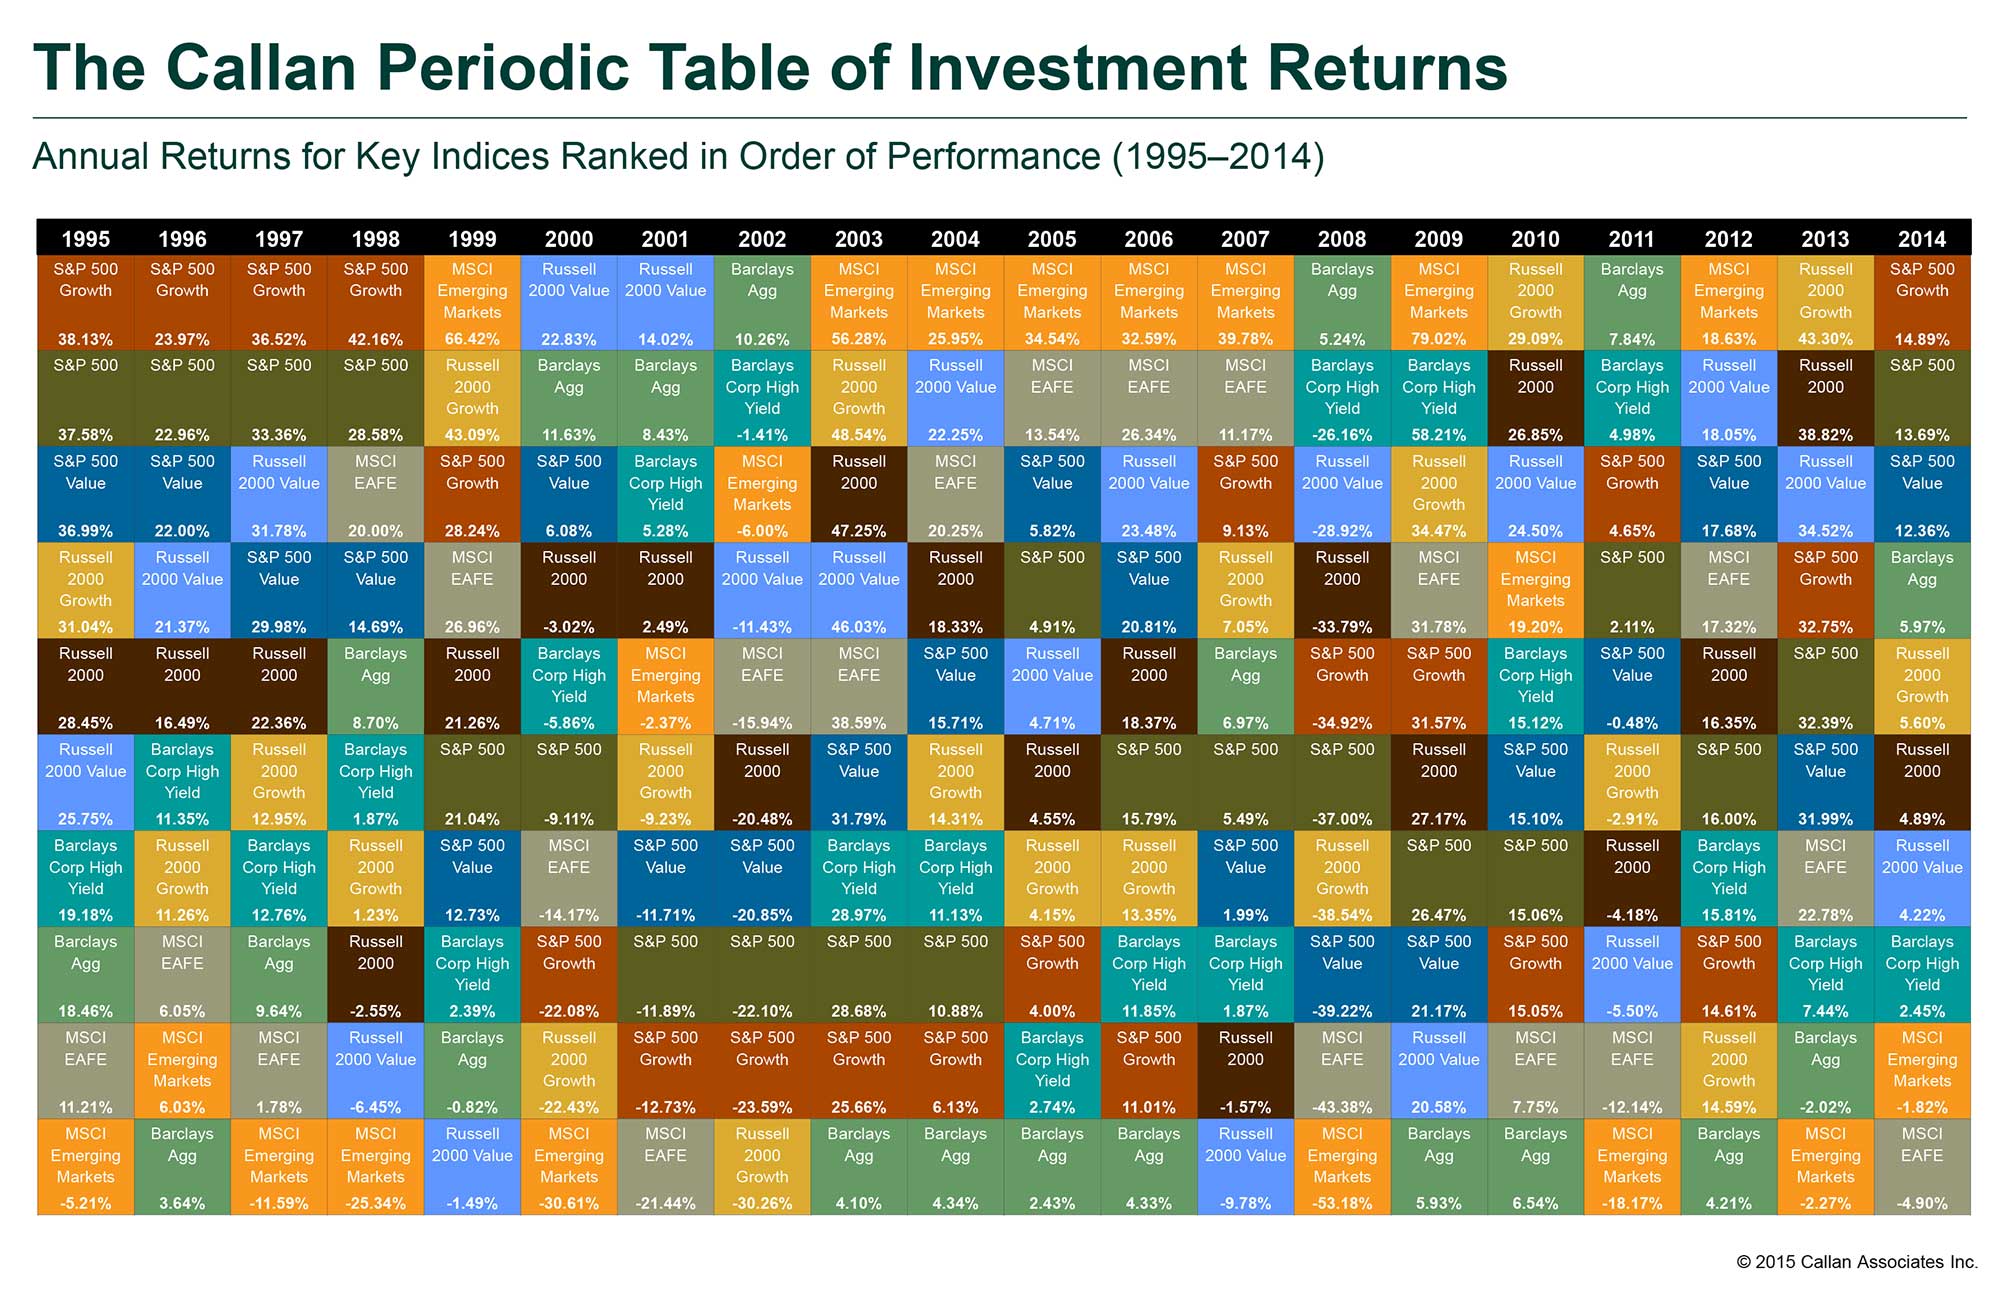
As you can see, there is no asset class that consistently outperforms all others. There are certainly short-term trends of outperformance. (For example, large cap U.S. growth stocks from 1995 to 1999, or foreign stocks, especially emerging markets, from 2004 to 2007.) But outperformance is usually followed by underperformance, and not in any predictable way. If you can discern a clear pattern in the returns over the last five years, from 2010 to 2014, you are a better student of the markets than I. So, are we unable to make any rational decisions about investment strategy and tactics? Is it all just a random, drunken walk, with no reliable information to guide our thinking?
We think not. In past articles, I’ve explained why we suspect the long-term opportunity set defined by the S&P 500 Stock Index is likely to offer disappointing returns. Fortunately, we need not be limited by that opportunity set. We simply need to broaden our search beyond that one army-green style box on the Callan chart, and look toward others among the fourteen asset classes we track in our target portfolios. There we can hope to find potentially powerful, actionable insights by examining historical price and/or yield relationships.
Let’s focus on one particular opportunity, based on the relationship between the prices of the S&P 500 Stock Index and the MSCI EAFE index of foreign, developed-market equities, as shown in the chart below:

Our data suggests the S&P 500 is likely to return somewhere between 2% and 5% per year over the next decade.
The chart data suggests that foreign stocks are priced more cheaply, relative to the S&P 500, than they have been since 1969, when the Morgan Stanley EAFE (Europe, Australia, Far East) Index was created. If we examine the three prior peak-S&P events, we can see that the EAFE delivered a forward return advantage between +3.5% and +7% per year for the following three years.
This suggests that today the MSCI EAFE Index may present us with an opportunity set with potential annual returns in the mid-to-high single digits (5% to 10%) over the next few years.
This is one of those apparent opportunities that is both exciting and scary. Exciting, because there has historically been a strong tendency for prices for these two market baskets to both diverge and converge, suggesting that they are not simply correlated, but cointegrated. Doubly exciting, because the potential for EAFE outperformance suggests a partial solution to the problem of low structural returns on U.S. equities. Scary, because as long as the S&P 500 continues to outperform, driven largely by the strength of the U.S. dollar, our diversified portfolios will underperform the most widely-followed index.
All of which simply reaffirms something we’ve known for years—the possibility of long-term outperformance requires the acceptance of periodic short-term underperformance. Right now we are paying that price.
By James S. Hemphill, CFP®, ChFC®, CIMA | Chief Investment Strategist Jim has been a CERTIFIED FINANCIAL PLANNER™ professional since 1982. He also holds the Chartered Life Underwriter certification and the Chartered Financial Consultant and Certified Investment Management Analyst designations. Jim specializes in complex wealth transfer and retirement transition strategies.
Please remember that past performance may not be indicative of future results. Different types of investments involve varying degrees of risk, and there can be no assurance that the future performance of any specific investment, investment strategy, or product (including the investments and/or investment strategies recommended or undertaken by TGS Financial Advisors), or any non-investment related content, made reference to directly or indirectly in this article will be profitable, equal any corresponding indicated historical performance level(s), be suitable for your portfolio or individual situation, or prove successful. Due to various factors, including changing market conditions and/or applicable laws, the content may no longer be reflective of current opinions or positions. Moreover, you should not assume that any discussion or information contained in this article serves as the receipt of, or as a substitute for, personalized investment advice from TGS Financial Advisors. To the extent that a reader has any questions regarding the applicability of any specific issue discussed above to his/her individual situation, he/she is encouraged to consult with the professional advisor of his/her choosing. TGS Financial Advisors is neither a law firm nor a certified public accounting firm and no portion of this article’s content should be construed as legal or accounting advice. A copy of the TGS Financial Advisors’ current written disclosure statement discussing our advisory services and fees is available upon request.