Dow 20,000: The Allure of Getting High

On Wednesday January 25, 2017, after several months of sideways action, the Dow Jones Industrial Average hit 20,000. In fact, the market closed sharply higher, at 20,068.51. What does it mean? The short answer is: not much. Let’s review some market history for context.
• January 18, 1966 – The Dow breached the 1,000 mark for the first time on, peaking at 1,000.50, but it failed to hold and closed lower.
• November 14, 1972 – The DJIA finally closed above 1,000 for the first time. Again, the market failed to hold the high.
• April 1, 1981 – Shortly after the November 1980 election of Ronald Reagan as our 40th president, the Dow hit 1,000 for the third time. With a new president committed to tax cuts and free-market reforms, there was hope that both the U.S. economy and the stock market would finally begin ticking up. The market made a post-election closing high in April of 1981.
• August 19, 1982 – Unfortunately, those optimistic hopes were dashed. After spending the fall of 1980 and early spring of 1981 flirting with the 1,000 level, the market began a deep slide that ended with the Dow at 776.
• From January of 1966 to November of 1980 – The price of the Dow Jones advanced less than 0.1% per year, during a 14-year interval when inflation averaged almost 6.9% per year. For a generation of investors those repeated peaks at Dow 1,000 defined their viewpoint on the stock market. Many believed that 1,000 represented a kind of upper bound for stocks, with a lower limit periodically re-established depending on the particular flavor of bad news of the day—losing war, recession, energy crisis, high inflation, national malaise.
• March 29, 1999 – The Dow closes above 10,000 for the first time.
• From the market low in August of 1982 through the recent high – We saw a price advance of 22:1, an annualized price return of +9.4% (over 11% annually adding dividends). Not a bad result over less than two generations, especially with inflation deducting less than 2.7% per year!
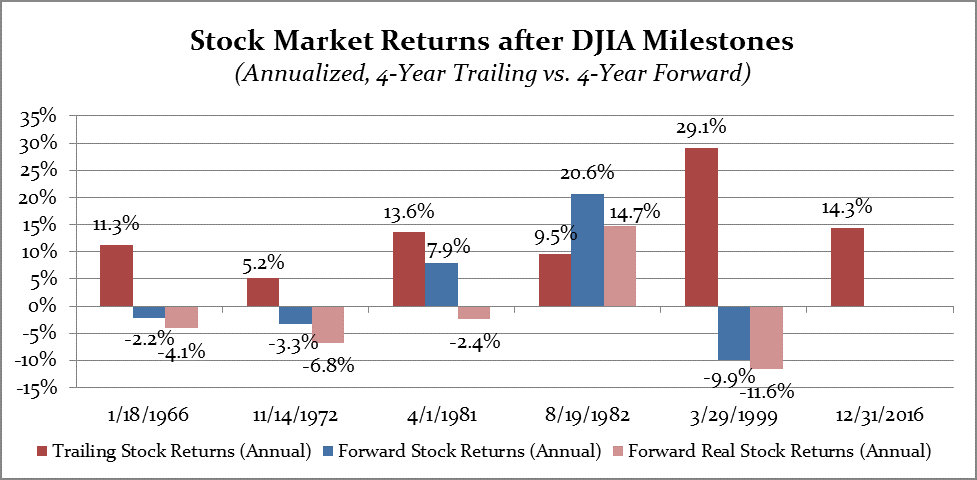
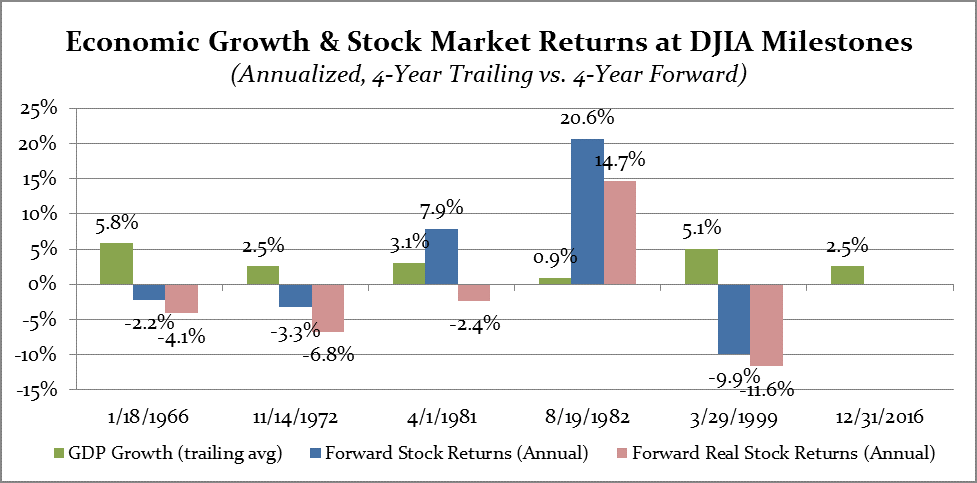
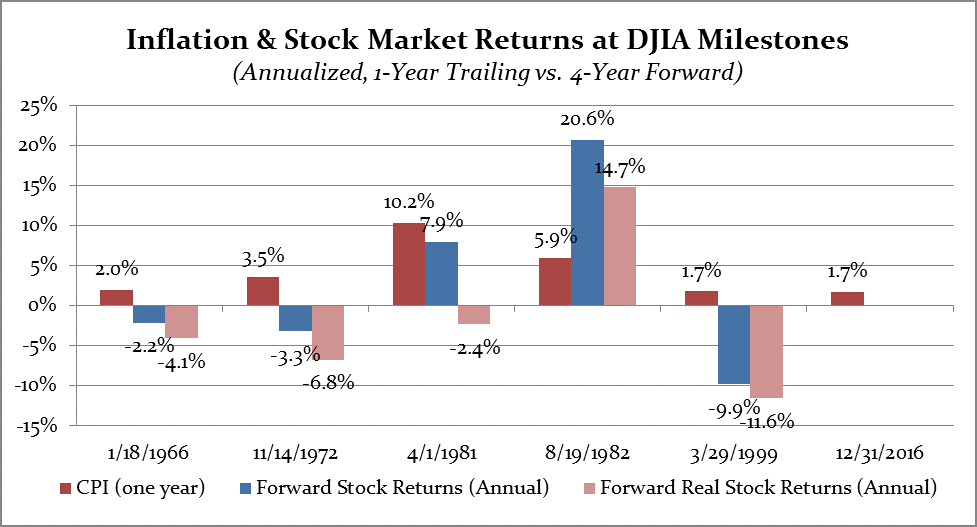
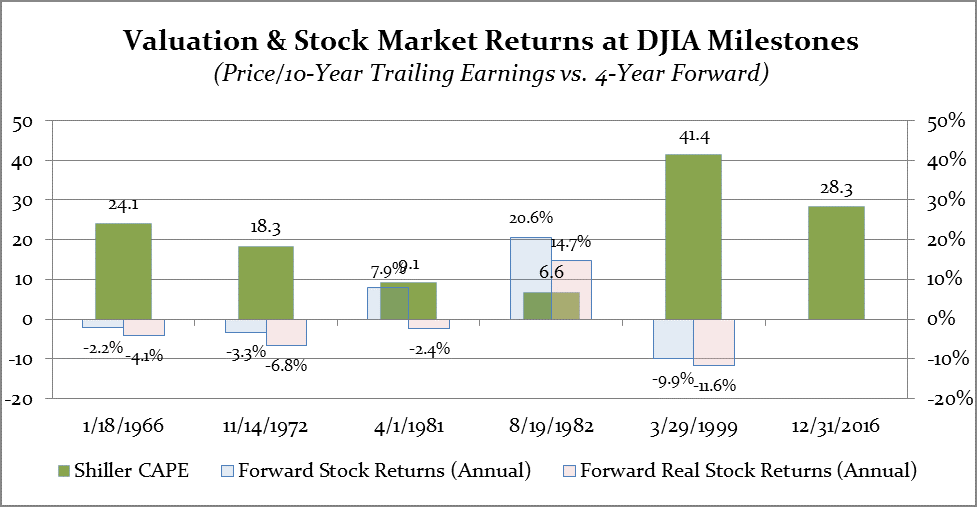
Now we’ve got another new president, and we’ve broken a level 20 times higher than was reached early in Reagan’s first term. What are our expectations for today’s Dow? To try and answer that question, I’m going to examine the market’s performance at five differing DJIA milestones and against four metrics: average stock market return over the prior four years, economic growth over the prior four years, inflation rate over the prior year, and stock market valuation, measured by Shiller CAPE.
What can we conclude from this data set?
First, let’s reaffirm a key observation. Prior returns offer no predictive value in projecting future returns, though investors perpetually behave as if they do, by consistently chasing the highest-performing asset class or mutual fund. Strong returns in the mid-1960s and late 1970s were followed by inflation-adjusted declines. The strongest market of our lifetimes, in the late 1990s, was followed by severe declines in the early 2000s.

Similarly, there is no clear and simple relationship between recent economic growth and future stock market returns. In fact, the period of the strongest stock market performance (the mid-1980s) came immediately after the period of weakest economic growth (the Carter/Volcker/Reagan recession of 1980-1982).
Let’s dive a little deeper, because this conclusion seems counterintuitive. Doesn’t higher growth mean higher profits? And aren’t profits what ultimately drive stock prices?
Kinda sorta. At inflection points, stock prices and economic reversals move in tandem; we have all seen bear markets precede economic downturns, and market upturns anticipate economic recoveries. But higher rates of growth don’t translate directly into higher stock prices, nor does weaker economic growth depress stock performance.
During the Bush/Obama years, relatively slow economic growth went along with higher equity prices, since the lion’s share of tepid growth went principally to the bottom line of corporations and their shareholders, while middle-class wages were quite flat. There is a powerful irony in the fact that corporate profits reached their highest-ever percentage of GDP during the administration of a nominally-liberal Democrat.
New president Trump claims he’ll reverse the stagnation of household incomes by creating a fast-growing economy. It is possible he will. But such an increase in wages will most plausibly be the result of falling corporate profits, as a greater share of our capitalist system’s rewards flow to workers. This is persuasively positive for our democracy, but not clearly a positive for share owners.

What about inflation? The highest rate of inflation (1981) is associated with subsequent negative real returns on stocks, though it appears that the change in inflation may be as important as the absolute rate of inflation. The highest stock market returns in our data set actually occurred in the period after August of 1982, when inflation was high at 5.9%, but declining quickly from the double-digit rates of Carter’s last year in office.[1]

So what is left? As we’ve discussed many times, valuation almost always trumps other drivers of stock market returns. (No pun intended!) The best returns came after the lowest valuation in 1982, and the worst returns after the all-time highest valuations in 1999.
Here at the end of Trump’s first tempestuous days in office, stocks are expensive, in large part because inflation is low and the returns on other investments, like cash and bonds, are unusually low. If we assume that Trump’s primary intention is to increase economic growth rates, at the possible cost of higher inflation and rising interest rates, the results may be positive for middle class incomes, but the evidence suggests it will not be a positive for the stock market.

In today’s markets, we find ourselves in a period of low inflation, slow-to-moderate economic growth, low (but rising) interest rates and very high stock prices. We know that most of this conflicting information is noise, without any track record of predicting future returns. The one robust measure we have, valuation, signals caution if not downright pessimism. (Shiller CAPE is in the top 7% of historical valuations.)
What should we do as investors? We should ignore the Dow 20,000 milestone, pay attention to absolute valuation (Shiller CAPE) as well as relative valuation (U.S. vs. foreign stocks, growth vs. value, etc.). We are tilting the portion of our portfolios that is in U.S. stock assets defensive, and looking to overseas markets for the possibility of return advantage at the margin. You can learn more about our current stance from our recent webinar.
We wish for peace and prosperity for all Americans during Donald Trump’s term in the White House. We hope the country profits from his policies, but we should not necessarily expect to get paid well as investors for owning U.S. stock assets, regardless of Trump’s success or lack of it.
The unsexy lesson is, as always, that investment success requires us to manage our behaviors, especially at market inflection points. In this case, we should follow the evidence that all-time highs in equity markets are not a useful signal of still-higher prices to come.
[1] A considerable body of research on the impact of inflation on stock valuations appears to show quite persuasively that inflation has a more powerful inverse effect on stock values than any other single factor. This limited data set does not control for valuation, so the effect of inflation is masked.
By James S. Hemphill, CFP®, CIMA®, CPWA®/ Managing Director & Chief Investment Strategist
Jim has been a CERTIFIED FINANCIAL PLANNER™ professional since 1982. Jim specializes in complex wealth transfer and retirement transition strategies and coordinates TGS Financial’s investment research initiatives.
Please remember that past performance may not be indicative of future results. Different types of investments involve varying degrees of risk, and there can be no assurance that the future performance of any specific investment, investment strategy, or product (including the investments and/or investment strategies recommended or undertaken by TGS Financial Advisors), or any non-investment related content, made reference to directly or indirectly in this article will be profitable, equal any corresponding indicated historical performance level(s), be suitable for your portfolio or individual situation, or prove successful. Due to various factors, including changing market conditions and/or applicable laws, the content may no longer be reflective of current opinions or positions. Moreover, you should not assume that any discussion or information contained in this article serves as the receipt of, or as a substitute for, personalized investment advice from TGS Financial Advisors. To the extent that a reader has any questions regarding the applicability of any specific issue discussed above to his/her individual situation, he/she is encouraged to consult with the professional advisor of his/her choosing. TGS Financial Advisors is neither a law firm nor a certified public accounting firm and no portion of this article’s content should be construed as legal or accounting advice. A copy of the TGS Financial Advisors’ current written disclosure statement discussing our advisory services and fees is available upon request.


